Local Real Estate NewsThe Gardner Report July 1, 2021

Matthew Gardner on Post-Pandemic Recovery

The “demise of downtown” has been greatly exaggerated, according to Windermere’s Chief Economist, Matthew Gardner. That’s one assessment Gardner made recently, along with other observations about the current housing and job markets in the Seattle area.

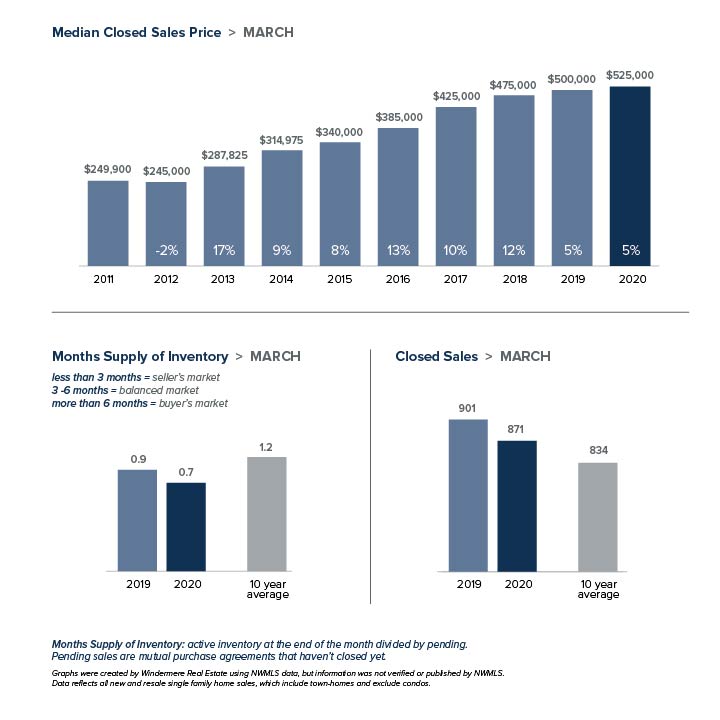
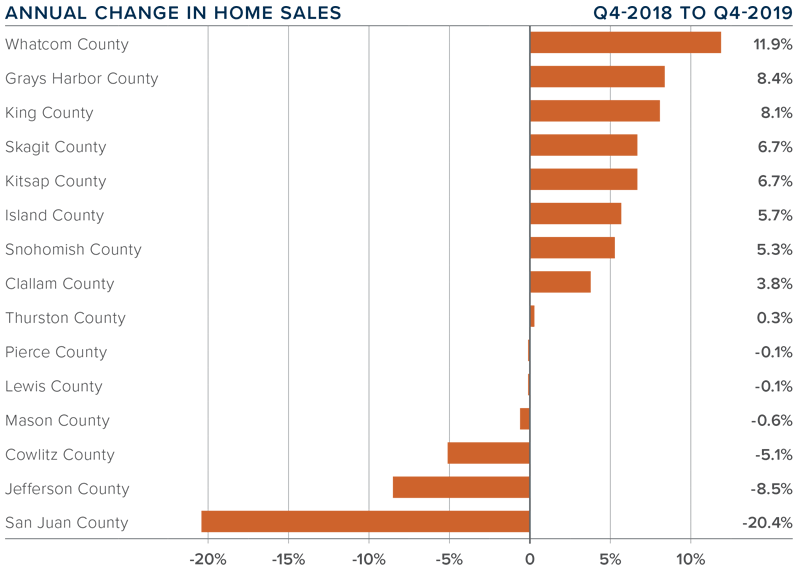
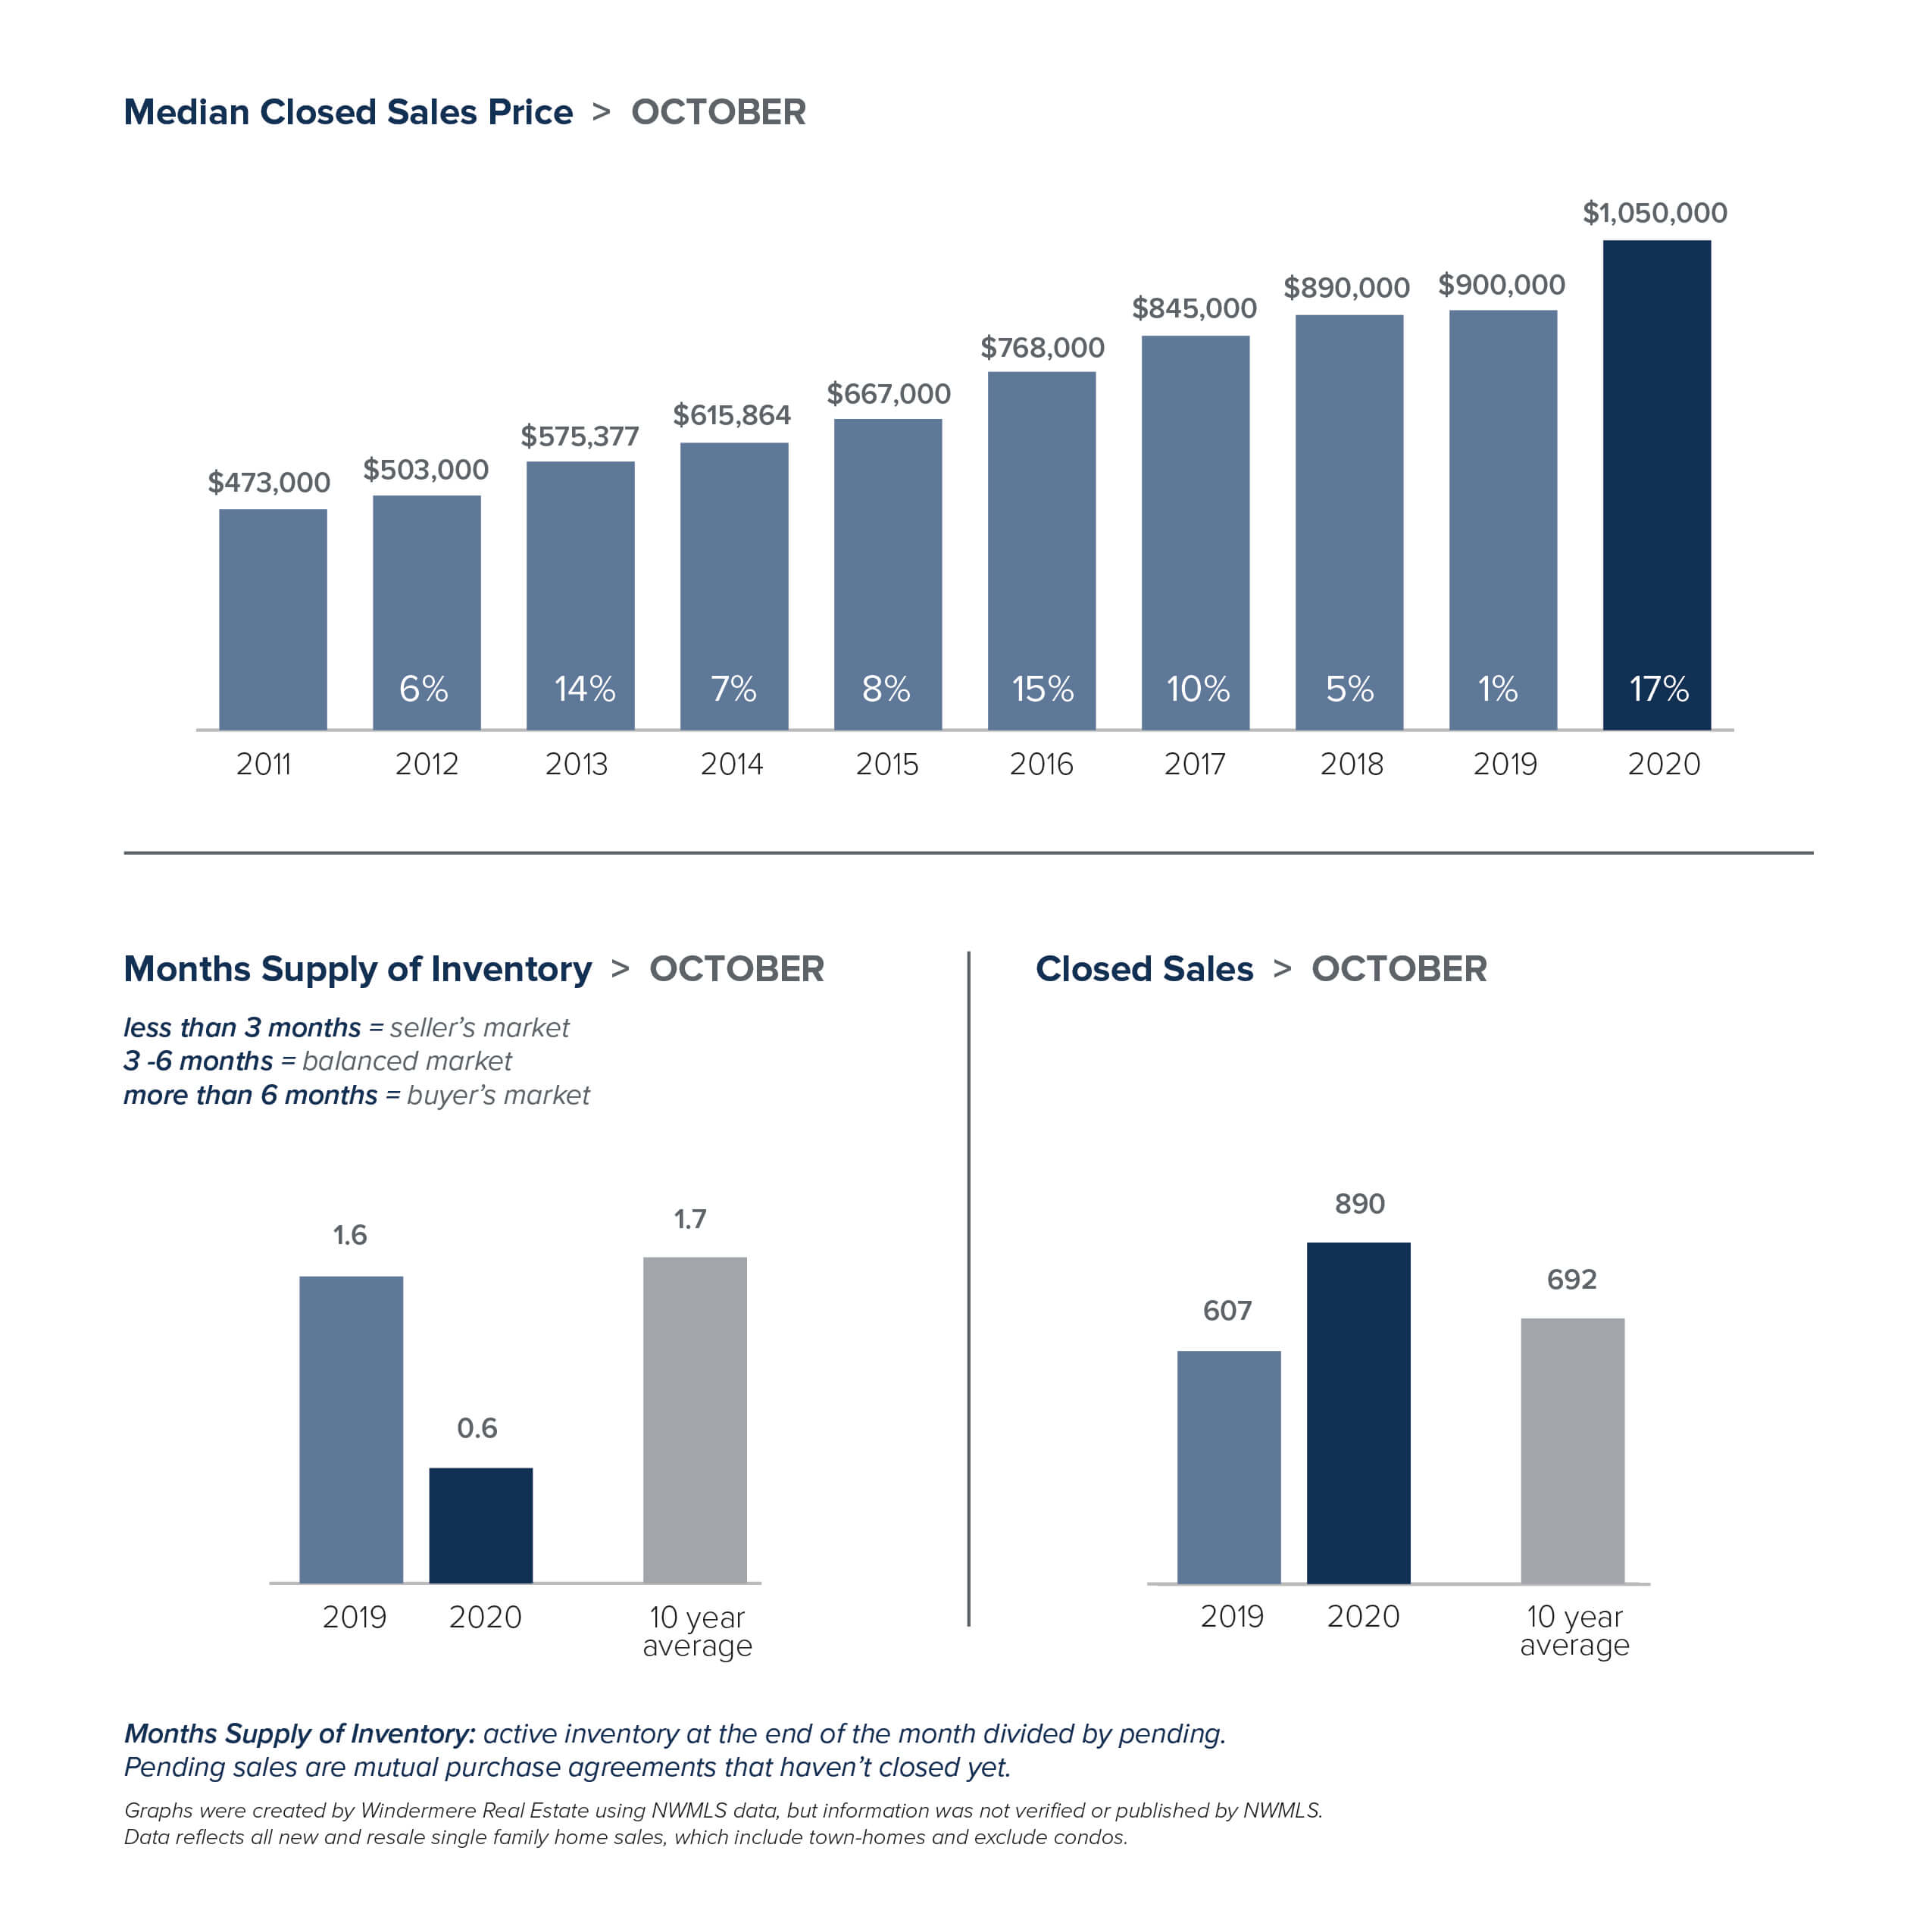
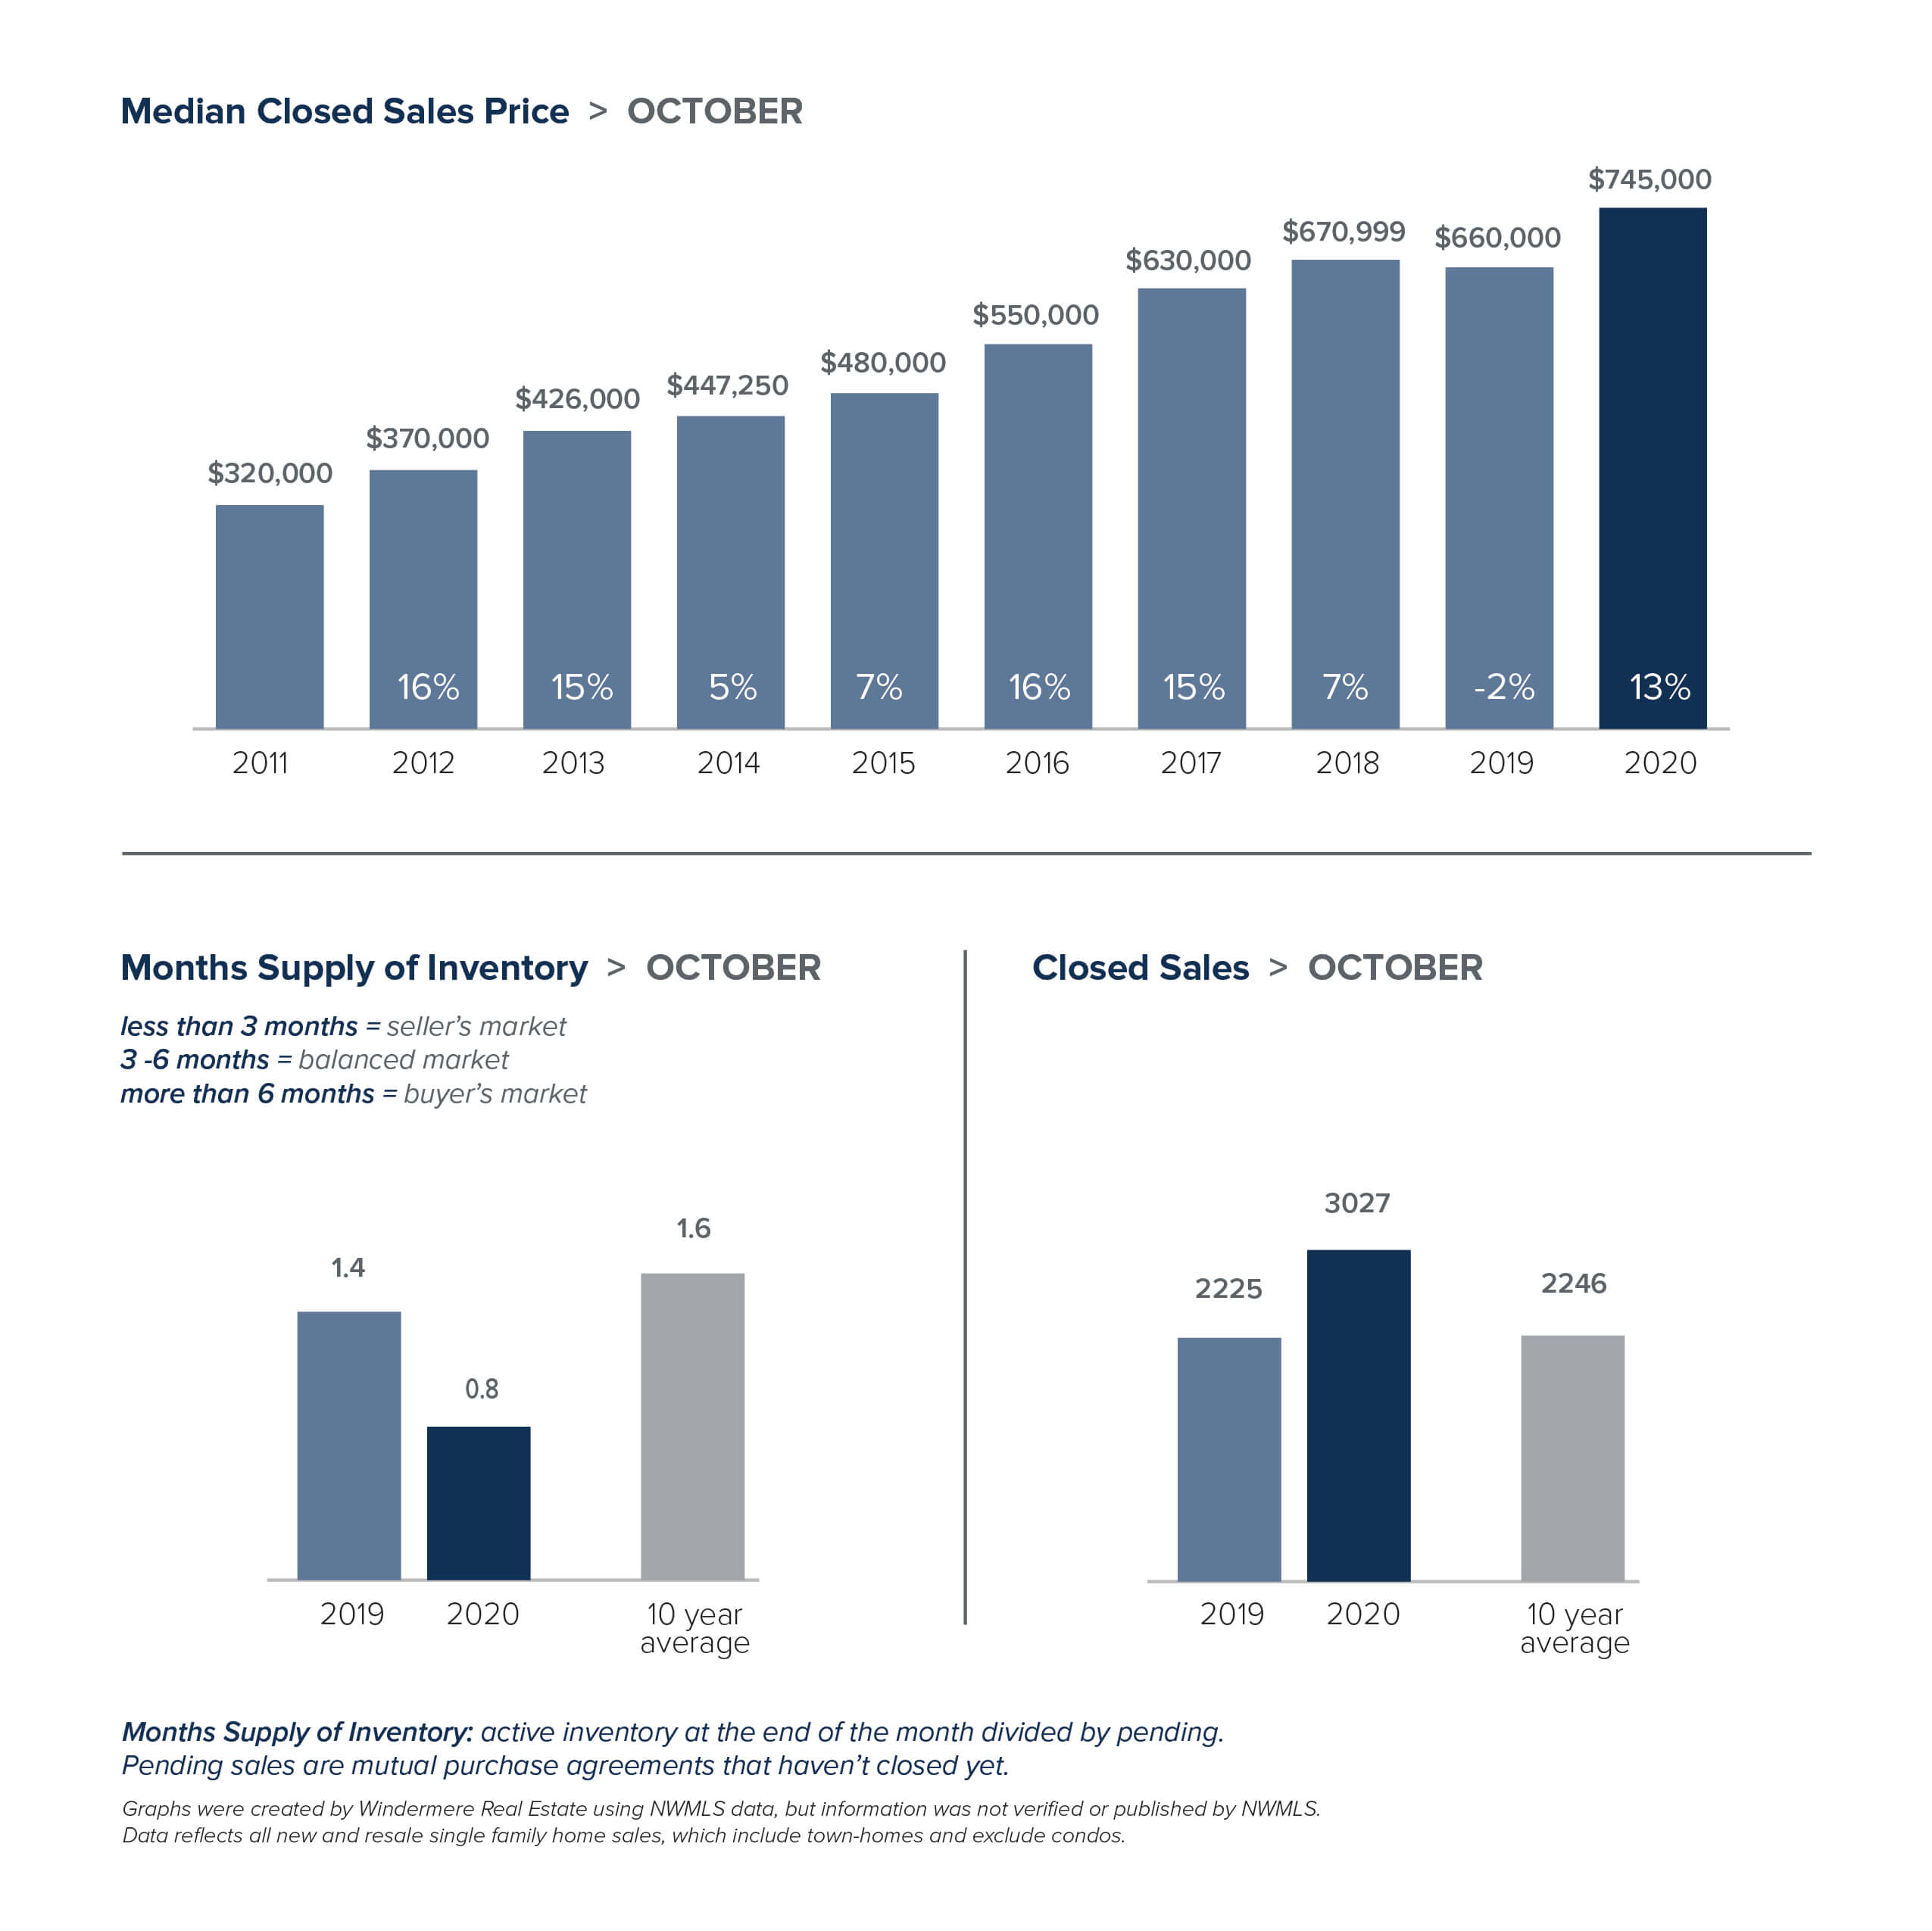
According to Gardner, those who keep tabs on the real estate market should be careful about reading too much into year-over-year price changes in the housing market. While King County is up 23.5% and Snohomish County is up by almost 33%, Gardner reminds us that the housing market was in a very different place a year ago than it is today. The early days of pandemic shutdowns basically put last spring’s real estate market on hold. So while this year’s price increases certainly indicate a level of economic recovery has taken place, the data needs to be viewed in context for it to be truly useful.

Overall, Gardner advises a cautious optimism regarding the regional economy. He observes that things are improving, but he says it’s important not to get carried away. While Gardner predicts a period of aggressive growth for the next year, he reminds us that many people were spending their money very cautiously this time last year, so naturally as the economy opens back up there will be built-in growth ahead.

On the subject of inflation, many economists caution about rates akin to those of the 1970s and 80s. Gardner, however, predicts a more moderate outcome. Although he thinks it’s likely we’ll have higher interest rates than we’ve seen in the last 30 years, he doesn’t believe we’ll see the same growth in the inflation rate. Gardner predicts that by 2022 things are likely to have settled down into a more typical pattern.

Finally, Gardner addresses the current levels of job loss caused by the pandemic. In total, the Puget Sound region lost about 216,000 jobs during the initial stages of the pandemic, but has since recovered about 103,000 of these. However, that recovery is not evenly distributed across industries. According to Gardner, construction has seen a full recovery of its jobs, and tech and information jobs were minimally impacted by the pandemic. On the other hand, the leisure and hospitality sectors have experienced much slower recovery, having lost about 79,000 jobs but adding back only about 29,000 of those.

As the leisure and hospitality sectors slowly recover from the pandemic, Gardner points out that there is another sign that the local economy is heading in the right direction: the growing demand for in-person entertainment and events. Though many large-scale events like conventions and concerts are still being planned out years in advance, the enthusiastic demand for these events and the easing of government restrictions preventing them is reason for optimism indeed.


This article was originally posted on MyNorthwest and GettheWReport.com

Local Market Update November 12, 2020

Local Market Update – November 2020

The number of people who can work remotely may be changing the way we view our homes, but one trend has not changed. The local housing market in October remained unseasonably hot. And that doesn’t show signs of changing any time soon.

October saw continued low inventory and record-level sales, with the number of sales exceeding that of 2019 year-to-date.

While new listings are on the rise, they are being snapped up quickly and many homes are selling in a matter of days. In King County there were 38% fewer single-family homes on the market as compared to a year ago. Snohomish County had 59% fewer listings. A four-month supply of homes for sale is considered a balanced market, but King and Snohomish counties currently have less than one month of supply.

With supply unable to keep up with demand, home prices are escalating at double-digit rates. The median single-family home price in King County rose 14% over a year ago to $745,000. Prices in Snohomish County jumped 17% year-over-year to a record high of $579,972. About half the homes that closed in October sold for over the asking price as compared to about a quarter of the homes the same time last year.

The real estate market here is uncommonly resilient. Growing employment in major tech industries and an enviable quality of life have made our region one of the fastest growing areas in the country. With interest rates remaining at record lows, we may well skip the traditional slowing in the winter market altogether.

The charts below provide a brief overview of market activity. If you are interested in more information, every Monday Windermere Chief Economist Matthew Gardner provides an update regarding the impact of COVID-19 on the US economy and housing market. You can get Matthew’s latest update here.

EASTSIDE

VIEW FULL EASTSIDE REPORT

KING COUNTY

VIEW FULL KING COUNTY REPORT

SEATTLE

VIEW FULL SEATTLE REPORT

SNOHOMISH COUNTY

VIEW FULL SNOHOMISH COUNTY REPORT


This post originally appeared on GetTheWReport.com

Local Market UpdateLocal Real Estate News June 11, 2020

Local Market Update – June 2020


As we move to the next phase of reopening, life feels like it’s slowly inching back towards normal. The same is true in real estate. Statistics on home sales in May provided the first true picture of the effects of COVID-19. Those reports confirmed the incredible strength and stability of the local real estate market.

  • The Stay Home order, as expected, continued to impact the number of sales. However, the market is starting to move its way towards more normal activity. Pending sales, a measure of current demand, have risen every week since April.
  • The slight drop in median closed sale price is a result of a proportionately larger number of lower priced homes selling than is normal. It should not be interpreted as a decrease in individual home value.
  • There were significantly fewer homes for sale in May than the same time last year. With less than a month of available inventory, competition among buyers was intense. Bidding wars and all-cash offers were common.

The monthly statistics below are based on closed sales. Since closing generally takes 30 days, the statistics for May are mostly reflective of sales in April. If you are interested in more information, every Monday Windermere Chief Economist Matthew Gardner provides an update regarding the impact of COVID-19 on the US economy and housing market. You can get Matthew’s latest update here. As we adapt to new phases of reopening, know that the safety of everyone remains our top priority.

EASTSIDE

VIEW FULL EASTSIDE REPORT

KING COUNTY

VIEW FULL KING COUNTY REPORT

SEATTLE

VIEW FULL SEATTLE REPORT

SNOHOMISH COUNTY

VIEW FULL SNOHOMISH COUNTY REPORT


This post originally appeared on GetTheWReport.com

Uncategorized April 23, 2020

Western Washington Real Estate Market Update

The following analysis of the Western Washington real estate market is provided by Windermere Real Estate Chief Economist, Matthew Gardner. We hope that this information may assist you with making better-informed real estate decisions. For further information about the housing market in your area, please don’t hesitate to contact your Windermere agent.


A MESSAGE FROM MATTHEW GARDNER

Needless to say, any discussion about the U.S. economy, state economy, or housing markets in the first quarter of this year is almost meaningless given events surrounding the COVID-19 virus.

Although you will see below data regarding housing activity in the region, many markets came close to halting transactions in March and many remain in some level of paralysis. As such, drawing conclusions from the data is almost a futile effort. I would say, though, it is my belief that the national and state housing markets were in good shape before the virus hit and will be in good shape again, once we come out on the other side. In a similar fashion, I anticipate the national and regional economies will start to thaw, and that many of the jobs lost will return with relative speed. Of course, all of these statements are wholly dependent on the country seeing a peak in new infections in the relatively near future. I stand by my contention that the housing market will survive the current economic crisis and it is likely we will resume a more normalized pattern of home sales in the second half of the year.


HOME SALES

  • There were 13,378 home sales during the first quarter of 2020, a drop of only 0.2% from the same period in 2019, but 27% lower than in the final quarter of 2019.
  • The number of homes for sale was 32% lower than a year ago and was also 32% lower than in the fourth quarter of 2019.
  • When compared to the first quarter of 2019 sales rose in eight counties and dropped in seven. The greatest growth was in Cowlitz and Lewis counties. The largest declines were in Island and Snohomish counties.
  • Pending sales — a good gauge of future closings — rose 0.7% compared to the final quarter of 2019. We can be assured that closed sales in the second quarter of this year will be lower due to COVID-19.


HOME PRICES

  • Home-price growth in Western Washington rose compared to a year ago, with average prices up 8.7%. The average sale price in Western Washington was $524,392, and prices were 0.4% higher than in the fourth quarter of 2019.
  • Home prices were higher in every county except San Juan, which is prone to significant swings in average sale prices because of its size.
  • When compared to the same period a year ago, price growth was strongest in Clallam County, where home prices were up 21.7%. Double-digit price increases were also seen in Kitsap, Skagit, Mason, Thurston, and Snohomish counties.
  • Affordability issues remain and, even given the current uncertain environment, I believe it is highly unlikely we will see any form of downward price pressures once the region reopens.


DAYS ON MARKET

  • The average number of days it took to sell a home in the first quarter of this year dropped seven days compared to the first quarter of 2019.
  • Pierce County was the tightest market in Western Washington, with homes taking an average of only 29 days to sell. All but two counties — San Juan and Clallam — saw the length of time it took to sell a home drop compared to the same period a year ago.
  • Across the entire region, it took an average of 54 days to sell a home in the first quarter of the year — up 8 days compared to the fourth quarter of 2019.
  • Market time remains below the long-term average across the region. This is likely to change, albeit temporarily, in the second quarter due to COVID-19.


CONCLUSIONS

This speedometer reflects the state of the region’s real estate market using housing inventory, price gains, home sales, interest rates, and larger economic factors.

Given the current economic environment, I have decided to freeze the needle in place until we see a restart in the economy. Once we have resumed “normal” economic activity, there will be a period of adjustment with regard to housing. Therefore, it is appropriate to wait until later in the year to offer my opinions about any quantitative impact the pandemic will have on the housing market.


ABOUT MATTHEW GARDNER

As Chief Economist for Windermere Real Estate, Matthew Gardner is responsible for analyzing and interpreting economic data and its impact on the real estate market on both a local and national level. Matthew has over 30 years of professional experience both in the U.S. and U.K.

In addition to his day-to-day responsibilities, Matthew sits on the Washington State Governors Council of Economic Advisors; chairs the Board of Trustees at the Washington Center for Real Estate Research at the University of Washington; and is an Advisory Board Member at the Runstad Center for Real Estate Studies at the University of Washington where he also lectures in real estate economics.


This post originally appeared on the Windermere.com Blog

Buying a HomeLocal Market UpdateSelling a Home April 14, 2020

Local Market Update – April 2020


Windermere is focused on keeping our clients and our community safe and connected. We’re all in this together. Since the early days of COVID-19, our philosophy has been “Go slow and do no harm.” While real estate has been deemed an “essential” business, we have adopted guidelines that prioritize everyone’s safety and wellness.

Like everything else in our world, real estate is not business as usual. While market statistics certainly aren’t our focus at this time, we’ve opted to include our usual monthly report for those who may be interested. A few key points:

  • The monthly statistics are based on closed sales. Since closing generally takes 30 days, the statistics for March are mostly reflective of contracts signed in February, a time period largely untouched by COVID-19. The market is different today.
  • We expect that inventory and sales will decline in April and May as a result of the governor’s Stay Home order.
  • Despite the effects of COVID-19, the market in March was hot through mid-month. It remains to be seen if that indicates the strong market will return once the Stay Home order is lifted, or if economic changes will soften demand.

Every Monday Windermere Chief Economist Matthew Gardner provides an update regarding the impact of COVID-19 on the US economy and housing market. You can get Matthew’s latest update here.

Stay healthy and be safe. We’ll get through this together.

EASTSIDE

VIEW FULL EASTSIDE REPORT

KING COUNTY

VIEW FULL KING COUNTY REPORT

SEATTLE

VIEW FULL SEATTLE REPORT

SNOHOMISH COUNTY

VIEW FULL SNOHOMISH COUNTY REPORT


This post originally appeared on GetTheWReport.com

Buying a HomeLocal Market UpdateSelling a Home March 12, 2020

Local Market Update – March 2020

The novel coronavirus (COVID-19) has not yet dampened demand in the housing market. Traffic at open houses remains heavy. Buyers who had waited last year for a drop in prices have now seen several months of home prices increases. With demand far outstripping supply and record low interest rates, the market heading into spring looks hotter than ever.

EASTSIDE

Buyers that may have been in wait-and-see mode at the end of 2019 jumped off the fence in February. Pending sales (offers accepted but not yet closed) jumped 27%, snapping up already-tight inventory. 55% of homes on the market sold in 15 days or less. The median home price jumped 9% over a year ago to $985,000, an increase of $58,000 from the prior month. Development on the Eastside continues to surge and includes the recent groundbreaking for a 600-foot tower in Bellevue and a proposed 11-acre mixed-use project.

VIEW FULL EASTSIDE REPORT

KING COUNTY

The tight housing market here got even tighter. There were 40% fewer homes on the market in King County in February than there were in January. The median home price rose 3% over the prior year to $675,000, up from $630,525 in January. With mortgage rates and the local unemployment rate both hitting record lows, demand isn’t likely to drop any time soon.

VIEW FULL KING COUNTY REPORT

SEATTLE

With just six weeks of available inventory, competition for homes in Seattle remains fierce. Multiple offers were the norm, and 34% of homes purchased in February sold for over the listing price. The median price for a single-family home in February was $730,500, unchanged from a year ago and up from $719,950 in January.

VIEW FULL SEATTLE REPORT

SNOHOMISH COUNTY

The numbers in Snohomish County tell the story. There were 42% fewer listings in February than a year ago, and 42% more pending sales. With inventory at under a month of supply, there just aren’t enough homes to meet demand. That scarcity translated into higher prices, with the median price of a single-family home rising 8% over a year ago to $515,000.

VIEW FULL SNOHOMISH COUNTY REPORT


This post originally appeared on GetTheWReport.com

Local Market Update February 17, 2020

Local Market Update – February 2020

New jobs and low interest rates continue to fuel the housing market boom. While January is traditionally a slower month for activity, the new year saw steady buyer demand. With the number of sales exceeding new listings, all indicators point to a strong spring market.

EASTSIDE

The tech industry on the Eastside continues to grow rapidly. Microsoft and Alibaba both have significant expansions underway. Amazon expects to increase its workforce in Bellevue to 15,000 in the next few years, a sevenfold increase from today. As the economy continues to grow, inventory keeps being squeezed. There were 47% fewer single-family homes on the market in January than the year prior. Home prices have been stabilizing for some time, fluctuating slightly from month to month. In January the median home price slipped 2% over a year ago to $892,000.

VIEW FULL EASTSIDE REPORT

KING COUNTY

The number of single-family homes on the market in King County was down nearly 44% from a year ago. That lack of inventory has resulted in more multiple offers and the return of review dates, where sellers identify a date to review all offers. Strong competition for a small supply of homes boosted the median home price 3% over the prior year to $630,525.

VIEW FULL KING COUNTY REPORT

SEATTLE

The jobs outlook in Seattle for 2020 remains robust, and demand for homes continues to outstrip supply. Traffic at open houses in January reflected that demand, with one central Seattle homes priced in the $1.2 million range drawing more than 300 visitors. Home prices in the city have been relatively stable for the past 12 months. That remained the case in January where the median price for a single-family home inched up 1% over last year to $719,950.

VIEW FULL SEATTLE REPORT

SNOHOMISH COUNTY

With 35% less inventory than last January, competition among buyers in Snohomish County is fierce and multiple offers have become the norm. The median price of a single-family home soared 12% over a year ago to $509,950. Home prices have been playing catch up, increasing at a much faster pace over the past year than King County. While the prices gap has closed, the median price here is still nearly 20% less than King County.

VIEW FULL SNOHOMISH COUNTY REPORT


This post originally appeared on GetTheWReport.com

The Gardner Report January 27, 2020

The Gardner Report – 2019 Q4 Western Washington

The following analysis of the Western Washington real estate market is provided by Windermere Real Estate Chief Economist, Matthew Gardner. We hope that this information may assist you with making better-informed real estate decisions. For further information about the housing market in your area, please don’t hesitate to contact me!


ECONOMIC OVERVIEW

Employment in Washington State continues to soften; it is currently at an annual growth rate of 1.7%. I believe that is a temporary slowdown and we will see the pace of employment growth improve as we move further into the new year. It’s clear that businesses are continuing to feel the effects of the trade war with China and this is impacting hiring practices. This is, of course, in addition to the issues that Boeing currently faces regarding the 737 MAX.

In the fourth quarter of 2019 the state unemployment rate was 4.4%, marginally lower than the 4.5% level of a year ago. My most recent economic forecast suggests that statewide job growth in 2020 will rise 2.2%, with a total of 76,300 new jobs created.

HOME SALES

  • There were 18,322 home sales registered during the final quarter of 2019, representing an impressive increase of 4.7% from the same period in 2018.
  • Readers may remember that listing activity spiked in the summer of 2018 but could not be sustained, with the average number of listings continuing to fall. Year-over-year, the number of homes for sale in Western Washington dropped 31.7%.
  • Compared to the fourth quarter of 2018, sales rose in nine counties and dropped in six. The greatest growth was in Whatcom County. San Juan County had significant declines, but this is a very small market which makes it prone to extreme swings.
  • Pending home sales — a barometer for future closings — dropped 31% between the third and fourth quarters of 2019, suggesting that we may well see a dip in the number of closed sales in the first quarter of 2020.

HOME PRICES

  • Home price growth in Western Washington spiked during fourth quarter, with average prices 8.3% higher than a year ago. The average sale price in Western Washington was $526,564, 0.7% higher than in the third quarter of 2019.
  • It’s worth noting that above-average price growth is happening in markets some distance from the primary job centers. I strongly feel this is due to affordability issues, which are forcing buyers farther out.
  • Compared to the same period a year ago, price growth was strongest in San Juan County, where home prices were up 41.7%. Six additional counties also saw double-digit price increases.
  • Home prices were higher in every county contained in this report. I expect this trend to continue in 2020, but we may see a softening in the pace of growth in some of the more expensive urban areas.

DAYS ON MARKET

  • The average number of days it took to sell a home dropped four days compared to the third quarter of 2019.
  • For the second quarter in a row, Thurston County was the tightest market in Western Washington, with homes taking an average of 29 days to sell. In nine counties, the length of time it took to sell a home dropped compared to the same period a year ago. Market time rose in four counties and two were unchanged.
  • Across the entire region, it took an average of 47 days to sell a home in the fourth quarter. This was up nine days over the third quarter of this year.
  • Market time remains below the long-term average across the region, a trend that will likely continue until we see more inventory come to market — possibly as we move through the spring.

CONCLUSIONS

This speedometer reflects the state of the region’s real estate market using housing inventory, price gains, home sales, interest rates, and larger economic factors.

The housing market ended the year on a high note, with transactions and prices picking up steam. I believe the uncertainty of 2018 (when we saw significant inventory enter the market) has passed and home buyers are back in the market. Unfortunately, buyers’ desire for more inventory is not being met and I do not see any significant increase in listing activity on the horizon. As such, I have moved the needle more in favor of home sellers.

As Chief Economist for Windermere Real Estate, Matthew Gardner is responsible for analyzing and interpreting economic data and its impact on the real estate market on both a local and national level. Matthew has over 30 years of professional experience both in the U.S. and U.K.

In addition to his day-to-day responsibilities, Matthew sits on the Washington State Governors Council of Economic Advisors; chairs the Board of Trustees at the Washington Center for Real Estate Research at the University of Washington; and is an Advisory Board Member at the Runstad Center for Real Estate Studies at the University of Washington where he also lectures in real estate economics.

This post originally appeared on the Windermere.com Blog.

Buying a HomeLocal Market UpdateSelling a Home January 15, 2020

Local Market Update – January 2020

2019 ended with too many buyers chasing too few homes. December marked the sixth straight month of declining supply. The severe shortage of homes, historically low interest rates, and strong job growth are predicted to keep the local housing market strong in 2020. In a region starved for inventory, sellers can expect significant interest in new listings.

EASTSIDE

Homes sold briskly on the Eastside in December in all categories, including the luxury market. The number of listings were down nearly 50% from a year ago and the area had under a month of available inventory. That lack of inventory helped bump the median price of a single-family home up 4% from a year ago to $949,000, which is a $49,000 increase from November.  New large scale developments and a strong economic forecast indicate that the housing market will remain healthy.

VIEW FULL EASTSIDE REPORT

KING COUNTY

King County continues to be a seller’s market. Inventory in December was down nearly 40% compared to a year ago and ended the month with below one month supply. The median price of a single-family home rose 6% over the prior year to $675,000, up slightly from November. More affordable areas saw much higher increases. Southeast King County – which includes Auburn, Kent and Renton – saw home prices jump 16% over the previous year.

VIEW FULL KING COUNTY REPORT

SEATTLE

Numbers tell the story in Seattle. Inventory was down 25%, while the number of closed sales increased 19%. Strong demand here has kept the housing market solid, with prices fluctuating slightly month-to-month for much of 2019. The median price of a single-family home sold in December increased 2% from a year ago to $727,000. That was slightly down from $735,000 in November.

VIEW FULL SEATTLE REPORT

SNOHOMISH COUNTY

While the median home price in Snohomish County is less than that in King County, the gap continues to close. Buyers willing to trade a longer commute for a lower mortgage have kept demand and prices strong. Inventory here was off 36% in December as compared to a year ago. The median price of a single-family home rose 9% over a year ago to $510,000, an increase of $15,000 from November.

VIEW FULL SNOHOMISH COUNTY REPORT


This post originally appeared on GetTheWReport.com

Buying a HomeLocal Market UpdateSelling a Home December 17, 2019

Local Market Update – December 2019

Favorable interest rates and soaring rents boosted activity in the housing market in November. More buyers competing for less inventory kept home prices strong. With the supply of homes far short of demand, sellers can expect well-priced properties to sell quickly this winter.

EASTSIDE

With just over a month of available inventory, demand on Eastside remains very strong. Sales are brisk, with 45% of single-family homes selling in 15 days or less and 20% of homes selling for over list price. The median single-family home price in November rose 2% from a year ago to $900,000 and was unchanged from October.

VIEW FULL EASTSIDE REPORT

KING COUNTY

With more buyers vying for fewer homes, King County remains a solid seller’s market. While inventory traditionally shrinks in the winter, this November saw the number of new listings at historic lows. Demand was strong, with the number of closed sales up 12% over the same time last year. The median home price ticked up 3% over the prior year to $661,000 and was unchanged from October. The strong market sent prices higher in the more affordable price ranges, with some areas in South King County seeing double-digit increases.

VIEW FULL KING COUNTY REPORT

SEATTLE

Activity in Seattle was very strong in November. The number of closed sales was up 29% over the same time last year. With just over one month of homes available for sale, the city is starved for inventory. Seattle homes prices have ebbed and flowed slightly from month to month for much of this year. The median price of a single-family home sold in November was off 3% from a year ago to $735,000.

VIEW FULL SEATTLE REPORT

SNOHOMISH COUNTY

With an increasing number of buyers driving to affordability, the Snohomish County housing market remains robust. Inventory is very tight and continues to fall. The county finished November with just over one month of supply. The median price of a single-family home rose 5% over a year ago to $495,000. That figure is unchanged from October.

VIEW FULL SNOHOMISH COUNTY REPORT


This post originally appeared on GetTheWReport.com