
 Facebook
 X
X
 Pinterest
 Copy Link
The Gardner Report – Second Quarter 2019


The following analysis of the Western Washington real estate market is provided by Windermere Real Estate Chief Economist Matthew Gardner. I hope that this information may assist you with making better-informed real estate decisions. For further information about the housing market in your area, please don’t hesitate to contact me.
Economic Overview
Washington State employment jumped back up to an annual growth rate of 2.4% following a disappointing slowdown earlier in the spring. As stated in the first quarter Gardner Report, the dismal numbers earlier this year were a function of the state re-benchmarking its data (which they do annually).
The state unemployment rate was 4.7%, marginally up from 4.5% a year ago. My current economic forecast suggests that statewide job growth in 2019 will rise by 2.6%, with a total of 87,500 new jobs created.
Home Sales Activity
- There were 22,281 home sales during the second quarter of 2019, representing a drop of 4.8% from the same period in 2018. On a more positive note, sales jumped 67.6% compared to the first quarterof this year.
- Since the middle of last year, there has been a rapid rise in the number of homes for sale, which is likely the reason sales have slowed. More choice means buyers can be more selective and take their time when choosing a home to buy.
- Compared to the second quarter of 2018, there were fewer sales in all counties except Whatcom and Lewis. The greatest declines were in Clallam, San Juan, and Jefferson counties.
- Listings rose 19% compared to the second quarter of 2018, but there are still a number of very tight markets where inventory levels are lower than a year ago. Generally, these are the smaller — and more affordable — markets, which suggests that affordability remains an issue.

Home Prices
-

Year-over-year price growth in Western Washington continues to taper. The average home price during second quarter was $540,781, which is 2.8% higher than a year ago. When compared to first quarter of this year, prices were up 12%.
- Home prices were higher in every county except King, which is unsurprising given the cost of homes in that area. Even though King County is home to the majority of jobs in the region, housing is out of reach for many and I anticipate that this will continue to act as a drag on price growth.
- When compared to the same period a year ago, price growth was strongest in Lewis County, where home prices were up 15.9%. Double-digit price increases were also seen in Mason, Cowlitz, Grays Harbor, and Skagit counties.
- The region’s economy remains robust, which should be a positive influence on price growth. That said, affordability issues are pervasive and will act as a headwind through the balance of the year, especially in those markets that are close to job centers. This will likely force some buyers to look further afield when searching for a new home.


Days on Market
- The average number of days it took to sell a home matched the second quarter of 2018.
- Snohomish County was the tightest market in Western Washington, with homes taking an average of only 21 days to sell. There were five counties where the length of time it took to sell a home dropped compared to the same period a year ago. Market time rose in eight counties and two were unchanged.
- Across the entire region, it took an average of 41 days to sell a home in the second quarter of 2019. This was the same as a year ago but is down 20 days compared to the first quarter of 2019.
- As stated above, days-on-market dropped as we moved through the spring, but all markets are not equal. I suggest that this is not too much of an issue and that well-priced homes will continue to attract attention and sell fairly rapidly.

Conclusions

Local Market Update – July 2019
The market in our region appears to be moderating. Inventory is up, prices are relatively stable and homes are taking a bit longer to sell. However, with less than two months of available inventory, supply is still far short of demand. Steady buyer activity, low interest rates and a thriving economy are making for a strong summer in the housing market.
Eastside
>>>Click image to view full report.
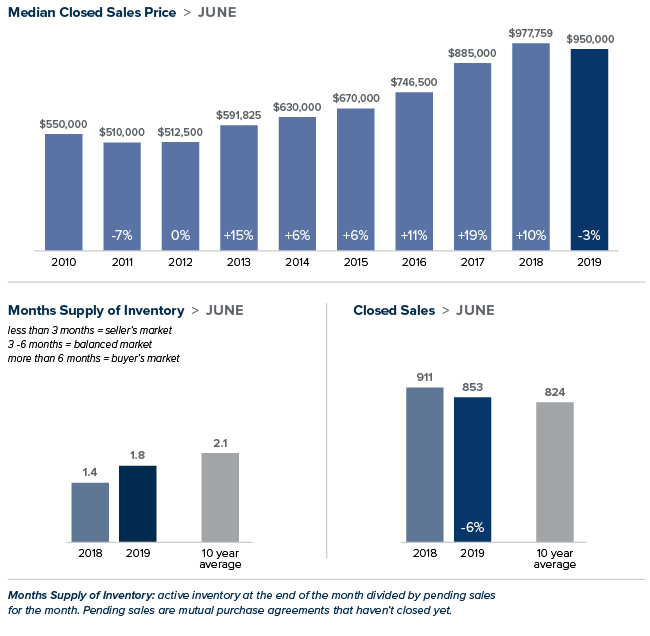
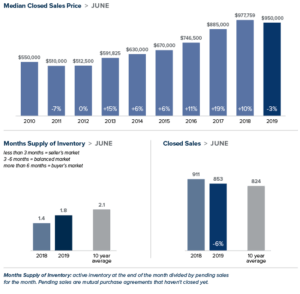
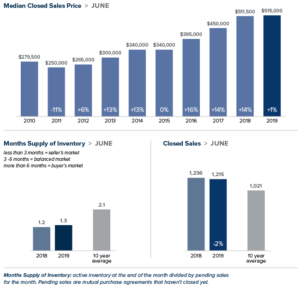
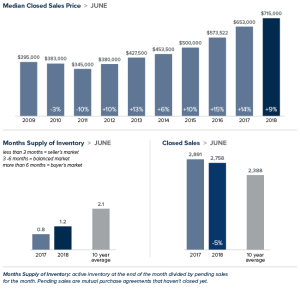
The median price of a single-family home on the Eastside was $950,000 in June, down 3% from the same time last year and up $21,000 from May. Many buyers are looking to take advantage of the Eastside jobs boom with Amazon announcing plans to build a 43-story tower in Bellevue and Google expecting to reach 1 million square feet of office space in Kirkland.
King County
>>>Click image to view full report.
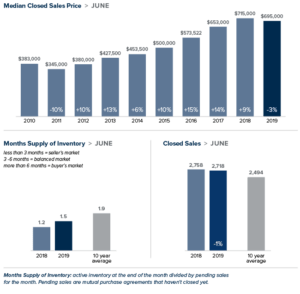
There was good news for buyers in June as a growing supply of homes helped boost inventory close to 2012 listing levels. The median price of a single-family home in King County was $695,000. That figure is a 3% drop from a year ago and virtually unchanged from May. 33% of homes sold above list price; another sign prices are moderating when compared to 52% of homes sold over list price this time last year.
Seattle
>>>Click image to view full report.
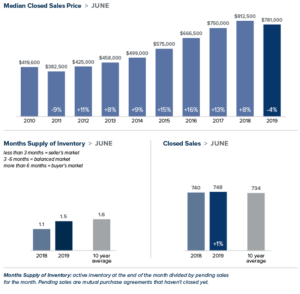
Home inventory in Seattle inched slightly higher in June. However, with less than two months of supply, the city is still a solid seller’s market. Apple’s plan to turn Seattle into a key engineering hub can only add to demand. The median price of a single-family home in Seattle was $781,000, down 4% from a year ago and nearly unchanged from May.
Snohomish County
>>>Click image to view full report.
After hovering around $500,000 since March, home prices in Snohomish County crept up in June. The median price of a single-family home was $515,500, as compared to $511,500 last June. Snohomish County continues to attract buyers priced out of the King County market, putting an additional strain on supply which stands a just 1.5 months of inventory.
This post originally appeared on the GetTheWreport.com.
Local Market Update – September 2018
The number of homes for sale in August increased dramatically over the same time a year ago. This is the result of a moderate increase in new listings and a much slower pace of sales. Homes are staying on the market longer, giving buyers more choices and more time to make an informed decision. While home prices are up compared to a year ago, the rate of increase was in the single digits rather than the double-digit surges of past months. It’s still a seller’s market, but sellers need to have realistic expectations about pricing their homes as the market softens.
Eastside

>>>Click image to view full report.
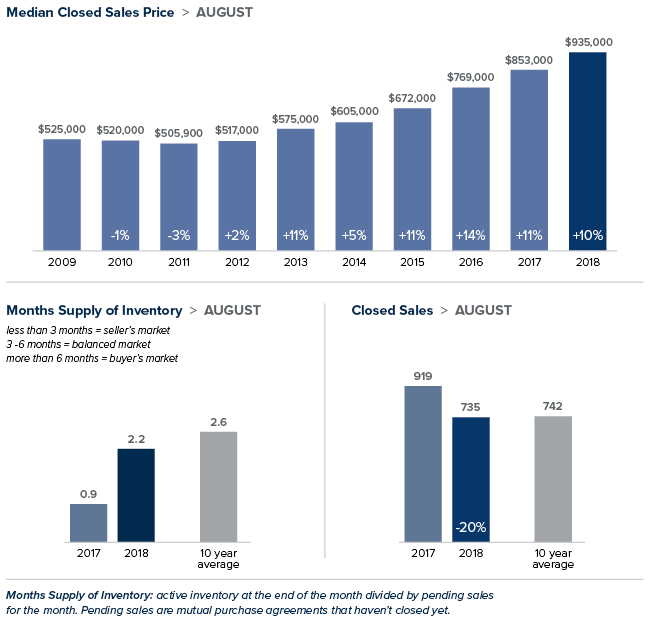
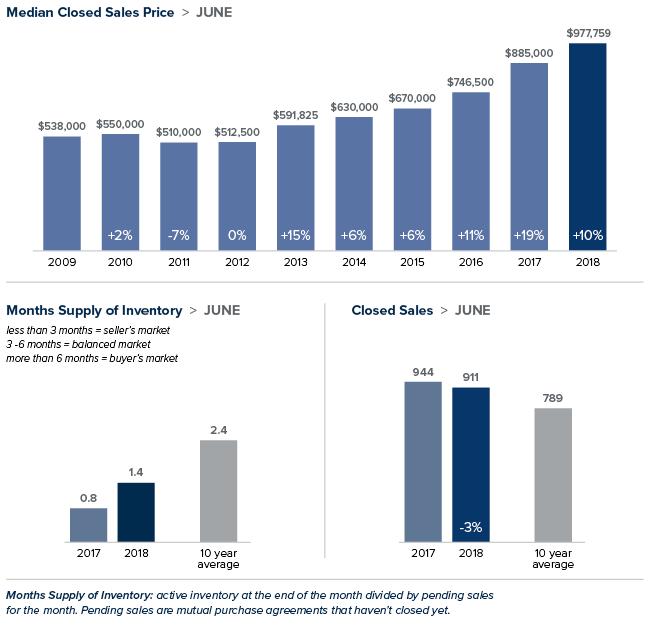
The median price of a single-family home on the Eastside was up nearly 10 percent from the same time last year to $935,000. Home prices have declined each month from the all-time high of $977,759 set in June. Inventory increased 73 percent over last August. With supply soaring and home prices moderating, sellers need to work with their broker to price their home to meet the current market conditions. A year ago 47 percent of the homes on the Eastside sold for over list price. This August that number was down to 29 percent.
King County

>>>Click image to view full report.
King County experienced yet another flood of inventory with the number of homes for sale jumping 65 percent over the previous year. Despite the growth, the county has just 1.9 months of inventory and remains a seller-oriented market. The market has slowed but it remains fast-paced, with 62 percent of the properties here selling in fewer than 15 days. While home prices were up 3 percent from a year ago, the median price of $669,000 represented the third straight month of declines from the record-high of $726,275 reached in May.
Seattle
>>>Click image to view full report.
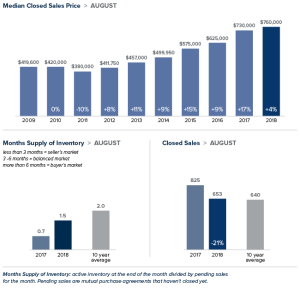
After leading the nation in home price growth for nearly two years, Seattle is finally cooling off. The median home price in August was $760,000, up just 4 percent from last year and down from the record $830,000 reached in May. Inventory soared in August, but the city still has just two months of supply, far short of the four to six months that is considered balanced. Bidding wars are becoming less common and price drops more common. Sellers must adjust their expectations to what appears to be a long waited moderating of the market.
Snohomish County
>>>Click image to view full report.
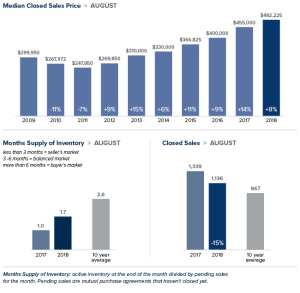
Mirroring the market slowdown in King County, Snohomish County also experienced a cooling off in August. The median price of a single-family home was $492,000, up 8 percent from a year ago but down from the record high of $511,000 two months prior. Inventory increased nearly 30 percent, but at just 1.6 months of supply the market remains very tight and sales are brisk. Sixty percent of homes here sold within 15 days.
This post originally appeared on the WindermereEastside.com Blog.
Local Market Update – July 2018
The local real estate market looks like it might finally be showing signs of softening, with inventory up and sales down. More sellers have opted to put their homes on the market. Inventory was up 47 percent in King County and price increases were in the single digits. Despite the increase in inventory and slowdown in sales, it’s still a solid seller’s market. Over half the properties purchased in June sold for more than list price.
Eastside

>>>Click image to view full report.
A booming economy offered little price relief for buyers looking on the Eastside. In a recent study of economic strength by state, Washington ranked number one in the country. An additional report targeting cities ranks the Seattle-Bellevue-Tacoma market as the nation’s fourth strongest economy. The median price of a single-family home on the Eastside rose 10 percent over a year ago to $977,759 setting another record. There is some good news for buyers. Inventory rose to its highest level in three years, with the number of homes for sale increasing 46 percent from the same time last year.
King County
>>>Click image to view full report.
The number of homes on the market in King County soared 47 percent from a year ago, the biggest increase since the housing bubble burst. Despite the increase, there is just over one month of available inventory, far short of the four to six months that is considered a balanced market. The median price of a single-family home increased 9 percent over last June to $715,000. That’s down 2 percent from the $726,275 median in May. Home prices haven’t dropped from May to June in King County since the last recession.
Seattle

>>>Click image to view full report.
Seattle trails only Bay Area cities when it comes to greatest profits for home sellers. That may help explain the surge in inventory in June. For example, the number of homes for sale in the popular Ballard/Green Lake area doubled from a year ago. Even though buyers are finally getting more choices, demand still exceeds supply. Homes sell faster in Seattle than in any other U.S. real estate market. That demand propelled the median price of a single-family home to $812,500; up 8 percent over last June and down from the record $830,000 set in May.
Snohomish County

>>>Click image to view full report.
The largest jump in home prices in the region came in Snohomish County. While higher-priced markets in King County are seeing increases slowing slightly, the median price of a single-family home here jumped 14 percent to $511,500, a new high for the county. Buyers willing to “keep driving until they can afford it” are finding Snohomish County an appealing destination.
This post originally appeared on the WindermereEastside.com Blog.
